Creating a Georeferenced CAD File
AutoPV reads and generates georeferenced PV layout designs. A PV layout design imported into AutoPV therefore needs to be set up with a suitable co-ordinate reference system (CRS) to be rendered on the map. PV layout designs generated by AutoPV can therefore also be easily imported into any GIS software with the correct real world location and scale resulting in construction-ready outputs.
This guide describes how to generate a georeferenced DXF file for your site that can be used to generate construction-ready PV layout designs.
ℹ️ This guide is based on utilizing QGIS running on Windows which is a free GIS application. Other GIS applications running on other platforms can also be used although their functions may be different.
Pre-requisites
- Google Earth (optional)
- QGIS
Locate the Site
The first step is to locate the site with a reference point. It is easier to do this using Google Earth, however, it can be done directly in QGIS too.
Creating a Reference Point with Google Earth
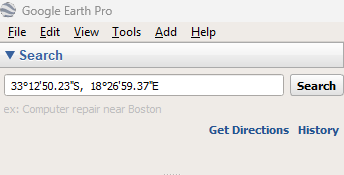
Enter the latitude and longitude co-ordinate for the site in the search bar and press Enter. The map will be zoomed to the site location.
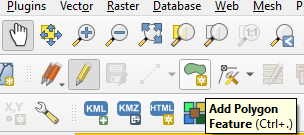
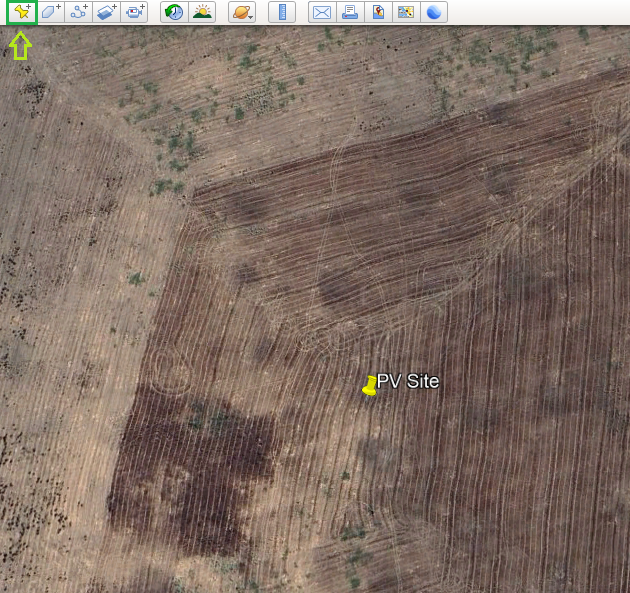
Click the Add Placemark button to place a reference point. Alternatively, a development area can also be drawn using the Add Polygon button.
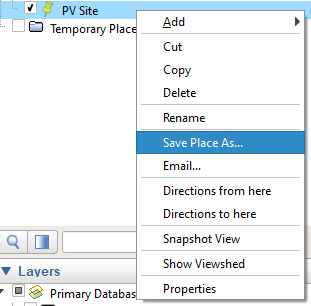
Export the reference point (or development area) as a kml by right clicking the feature in the Places list and choosing the Save Place As... command. Save the feature as a .kml file.
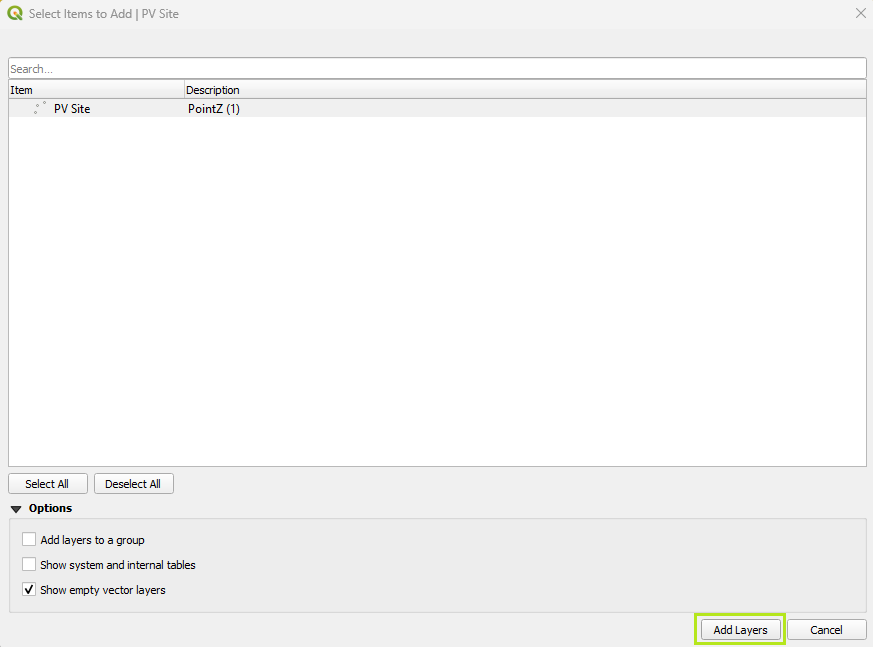
Open QGIS and drag and drop the .kml file into the workspace. Click the Add Layers button when prompted.
The contents of the kml file will be visible in the workspace.
Creating a Reference Point with QGIS
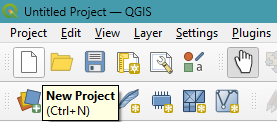
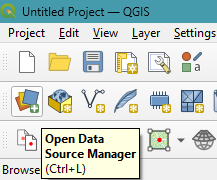
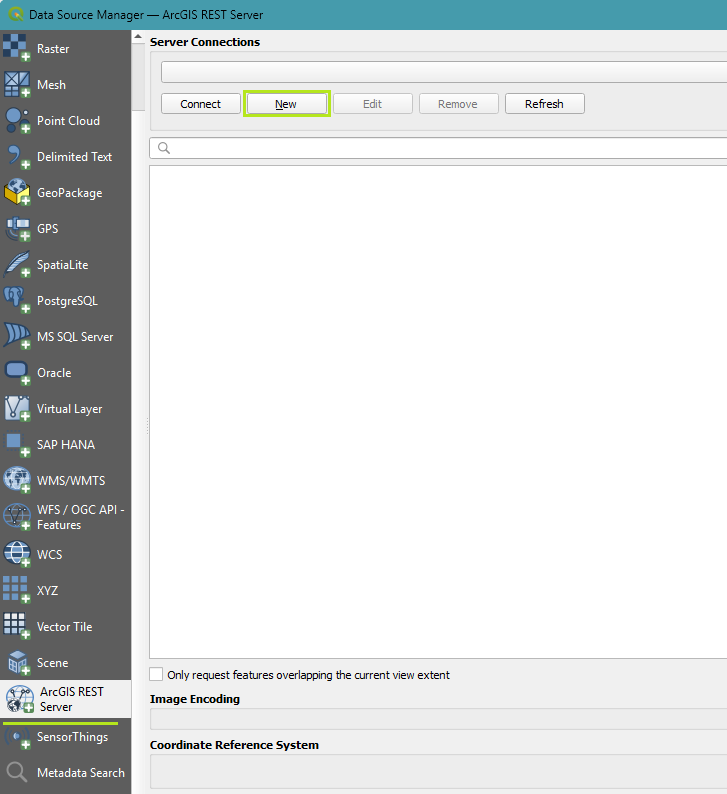
Open QGIS and click the New Project button. Add aerial imagery to the workspace by clicking the Open Data Source Manager button and choosing the ArcGIS REST Server category from the side bar.
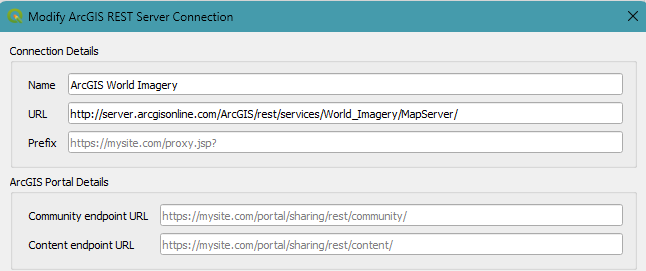
Click New to add a new datasource and use the following settings:
- Name: ArcGIS World Imagery
- URL: http://server.arcgisonline.com/ArcGIS/rest/services/World_Imagery/MapServer/
Click OK to save the datasource.
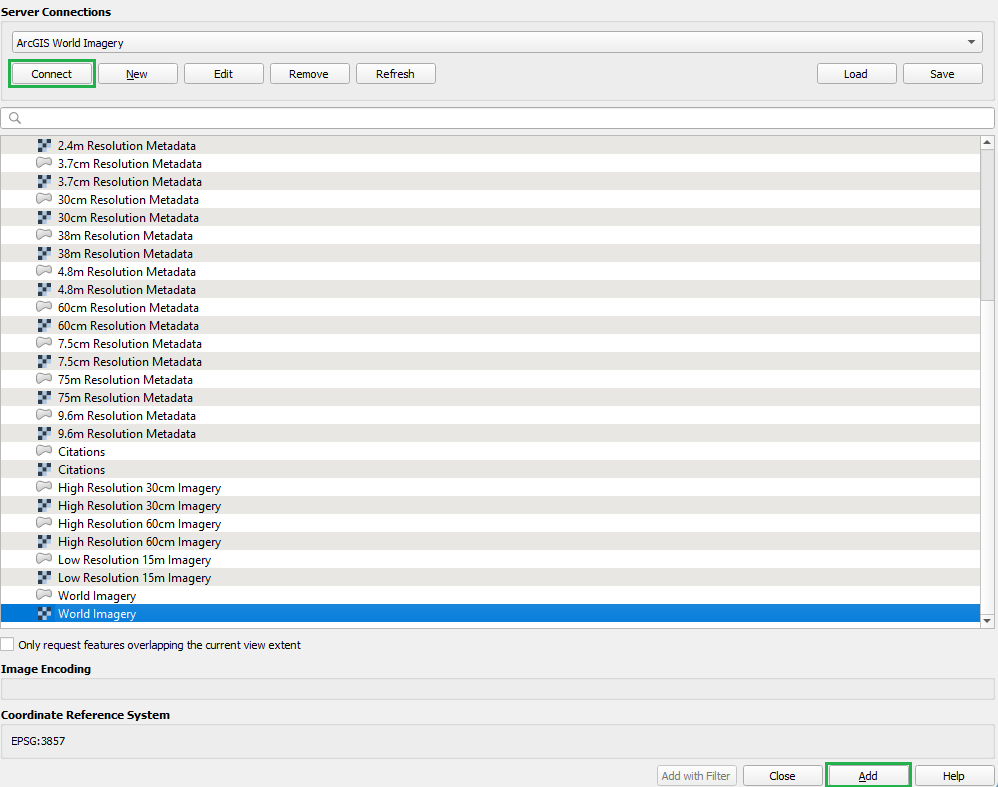
Click the Connect button and wait for the list of imagery to load. Scroll to the bottom of the list and choose the World Imagery raster option (the one with the tile icon) then click Add and close the window. Satellite imagery will be loaded in the workspace.
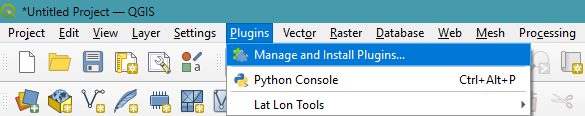
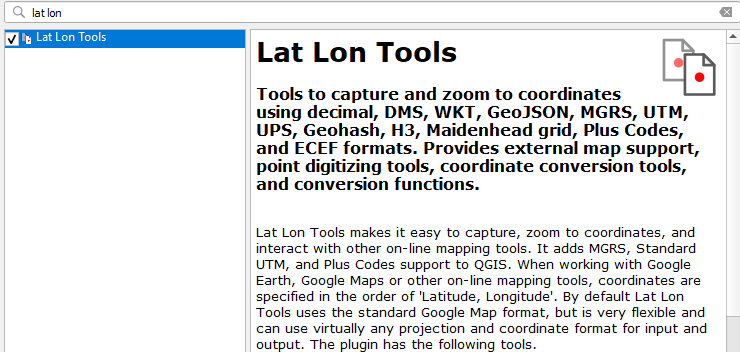
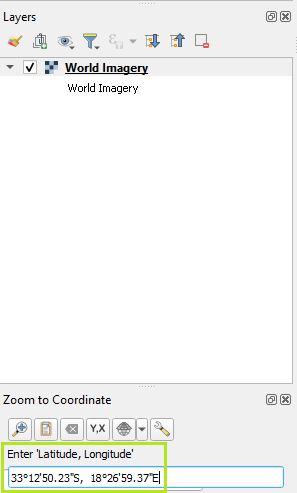
Next, install a plugin that enables co-ordinate searching by clicking the Plugins button at the top of the main toolbar and choose Manage and Install Plugins. Search for a plugin called Lat Lon Tools and install it.
A search bar will appear at the bottom of the screen. Insert the latitude and longitude of the site and press Enter. A red '+' sign will appear on the map locating the co-ordinate.
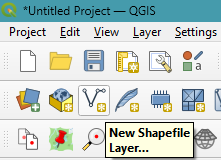
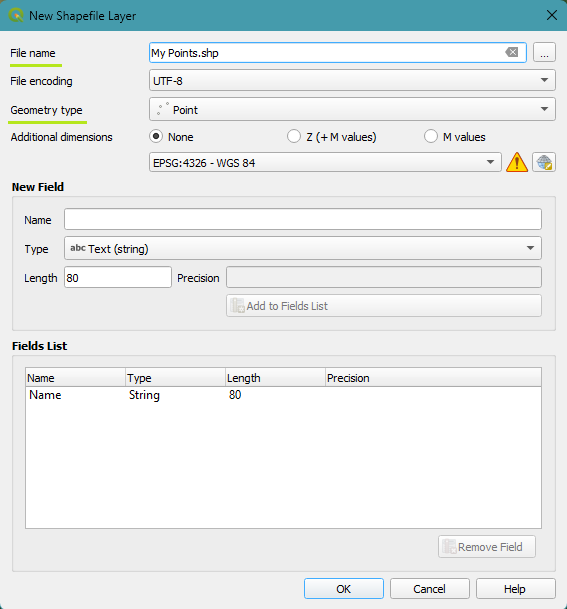
Finally, to insert a reference point, click the New Shapefile Layer button, specify any name in the File Name field and specify the Geometry type as Point in the dropdown list.
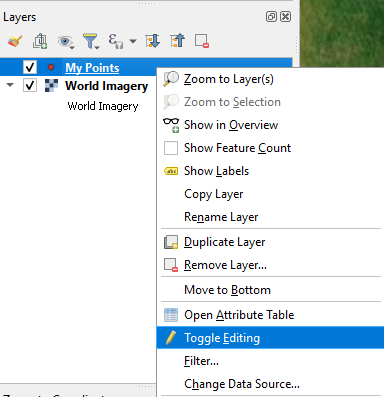
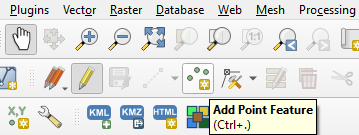
Right-click the newly created layer in the Layers panel and select the Toggle Editing command. In the main toolbar at the top of the screen, select the Add Point Feature or press ctrl + period (.). Click a location on the site to place a point.
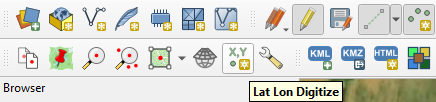
Alternatively, the Lat Lon Tools digitize tool can be used to place a point at a specified co-ordinate during layer editing mode.
Click the Toggle Editing button again to exit editing mode and save the changes.
Set the Co-ordinate Reference System (CRS) for the Site
If the CRS for the site / project is unknown, the universal UTM CRS (projection) can be used. Alternatively, the epsg.io website can be used to search for a relevant CRS for the site by entering the country in the search field.
The UTM projection is based on zones, with each zone covering a portion of the world map. Zones are also identified based on the northern or southern hemisphere e.g. zone 36S refers to zone 36 in the southern hemisphere while zone 36N refers to zone 36 in the northern hemisphere.
To select a UTM projection with minimal distortion for the site, the central meridian (or longitude of natural origin) needs to be as close as possible to the longitude of the site.
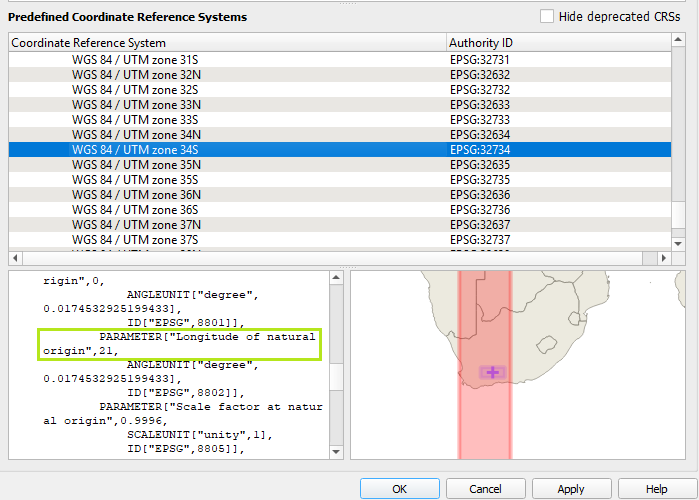
E.g. if the site is located at -33.802°, 22.080° (lat, lon), then UTM zone 34S (EPSG:32734) would be suitable since its central meridian (longitude) is located at 21°.
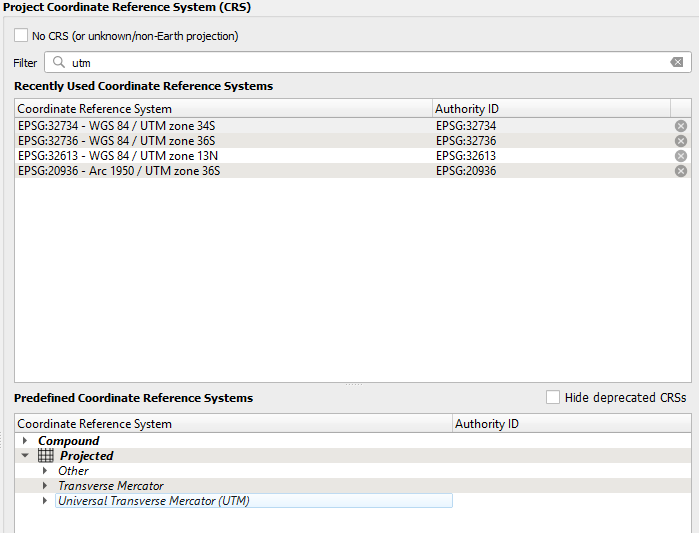
To find the central meridian and set a projection for the site in QGIS, click on the EPSG code shown in the bottom right which will open the CRS window.

Search for utm and choose the projected -> Universal Transverse Mercator category.
Clicking on a CRS in the list will display it's definition as well as the area of the map covered by the selected projection. The central meridian (longitude of natural origin) can be viewed in the definition. Choose an appropriate WGS 84 / UTM zone CRS then click the Apply button.
Development areas and site constraints can now be drawn with a high degree of accuracy and will be georeferenced when exported as a DXF file.
ℹ️ Given that this example site is in South Africa where the LO CRS system is used, an alternative CRS projection with higher accuracy that can be used is LO21 (Hartebeesthoek94_Lo21_(E-N), ESRI: 102563) since its central meridian is located at 21°. It is recommended to always use a country / site specific CRS where possible instead of UTM zones.
Export a Georeferenced DXF
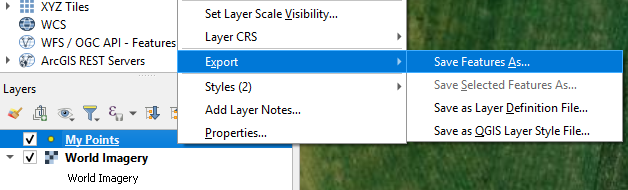
Now that the site has been located and the CRS has been set, right click the layer in the layers group and choose export -> Save Features As.
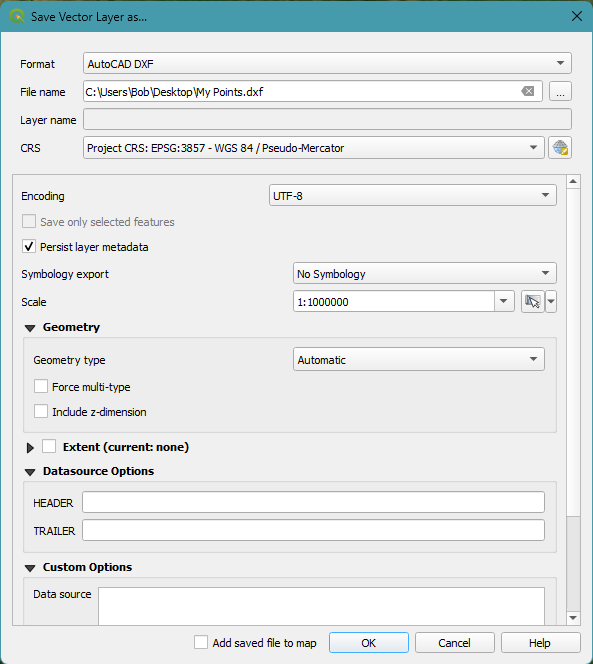
Specify the AutoCAD DXF format in the format dropdown list. Set the file name and location in the File Name field. In the CRS dropdown choose the newly set CRS which will be displayed as the Project CRS: ... in the dropdown list. Click OK to export the DXF.
The exported DXF is georeferenced and can now be used for generating accurate georeferenced PV layout designs.
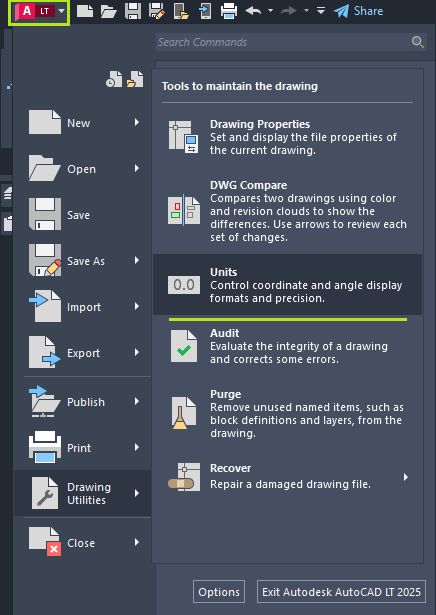
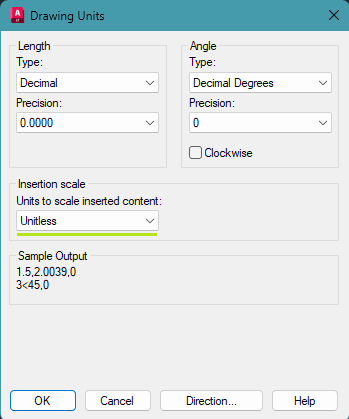
⚠️ Before generating any designs or creating block references in the DXF file, ensure that the DXF file's units are set to unitless by clicking the AutoCAD symbol in the top left and selecting the Units setting in the Drawing Utilities group. This is to prevent AutoCAD from automatically scaling newly created block references and inserted objects when using the copy/paste tool.
Creating Accurate Development Areas in GIS Software
If a development area instead of a reference point was imported from Google Earth into QGIS, some distortion of the development area will be visible when changing the CRS in QGIS. This is because the default CRS used by Google Earth is the Geographic WGS84 and when the development area is imported into QGIS, it is re-projected based on the selected CRS.
It is therefore good practice to generate development areas and constraints using GIS software with the correct CRS set for the site instead of Google Earth. For the above example, since the CRS was set to UTM zone 34S, a development area can be drawn in QGIS then exported as a DXF for generating a PV layout design in CAD.
To draw polygon areas in QGIS, create a new shapefile layer and set the geometry type to Polygon instead of Point. Toggle the layer editing mode and use the Add Polygon Feature button to draw a polygon.